TL;DR
Let’s create a CI/CD (Continuous Integration and Continuos Deployment) solution on top of Kubernetes, using Jenkins as building tool and Traefik as ingress for flexible application deployment and routing.
Source code is available on Github with example application and supporting files.
Goal
The main goal is to present a flexible CI/CD solution on top of Kubernetes, with automatic application deployment, host definition and routing per environment. To make this process easy to understand, the following steps are presented and described in detail:
- Setup Kubernetes and understand its basic concepts;
- Install Traefik, Dashboard and Jenkins using Helm;
- Create Kotlin application to show how CI/CD can be used;
- Implement Jenkins pipeline to build and deploy application automatically.
To fulfill the mentioned steps and validate the presented CI/CD solution, the architecture with the following components is proposed:
- Kubernetes: for containers management and orchestration;
- Traefik: as proxy and load balancer to access services;
- Kubernetes Dashboard: to manage Kubernetes through a web-based interface;
- Jenkins: as automation server to automatically build and deploy application;
- GitHub: to manage source code using Git;
- DockerHub: as registry to manage the Docker image with the example application;
- Application stating: example application deployment for development and testing purposes;
- Application production: example application deployment to be used in production.
 Figure: Components.
Behind the curtains and as supporting tools, the following technologies are also used:
- Docker: for services and applications containerization;
- Helm: for simplified services deployment and configuration on Kubernetes;
- Kotlin: to develop the example application, which will be automatically built and deployed to Kubernetes.
Regarding the CI/CD solution, this post will focus in two main interaction workflows, which are presented in the sequence diagram below:
- Build and deploy application: checkout latest source code version to build application and deploy it on Kubernetes cluster;
- Access application: use proxy for standardized access to deployed application on specific hostname.
 Figure: Sequence diagram.
Kubernetes
Kubernetes, also known as K8s, is the current standard solution for containers orchestration, allowing to easily deploy and manage large-scale applications in the cloud with high scalability, availability and automation level. Kubernetes was originally developed at Google, receiving a lot of attention from the open source community. It is the main project of the Cloud Native Computing Foundation and some of the biggest players are supporting it, such as Google, Amazon, Microsoft and IBM. Out of curiosity, Kubernetes is currently one of the top open source projects, being the one with highest activity in front of Linux. Nowadays, several companies already provide production-ready Kubernetes clusters, such as AWS from Amazon, Azure from Microsoft and GCE from Google. An official list of existing Cloud Providers is provided in the Kubernetes documentation.
Terminology
To understand how applications can be deployed, it is fundamental to introduce some of the core concepts, which are presented and briefly described below:
- Namespace: a virtual cluster that can sit on top of the same physical cluster hardware, enabling concern separation across development teams;
- Pod: is the smallest deployable unit with a group of containers that share the same resources, such as memory, CPU and IP;
- Replica Set: ensures that a specified number of Pod replicas are running at any given time;
- Deployment: a set of multiple identical Pods, defining how to run multiple replicas of the application, how to automatically replace any instances that fail or become unresponsive, and how to perform updates;
- Service: abstraction of a logical set of Pods, which is the only interface that other applications use to interact with;
- Ingress: to manage how external access to services is provided;
- Persistent Volume: a piece of storage used to persist data beyond the lifetime of a Pod.
 Figure: Kubernetes deployment concepts.
Architecture
Before jumping into installing and configuring Kubernetes, it is important to understand the software and hardware components required to setup a cluster properly. The figure below summarizes the required components architecture, together with a brief description of the role of each one:
- Master: responsible for maintaining the desired cluster state, being the entry point for administrators to manage the various nodes. The following software components run in the master:
- API Server: REST API that exposes all operations that can be performed on the cluster, such as creating, configuring and removing Pods and Services;
- Scheduler: responsible for assigning tasks to the various cluster nodes;
- Controller-Manager: to make sure that the cluster state is operating as expected, reacting to events triggered by controllers from throughout the cluster;
- etcd: distributed key-value store used to share information regarding cluster state, which can be accessed by all cluster nodes;
- Node: physical or virtualized machine that performs a given task, with the following components running:
- Docker: container runtime responsible for starting and managing containers;
- Kubelet: tracks the state of a Pod to ensure that all the containers are running as expected;
- Kube-proxy: routes traffic coming into a node from the service;
- UI: user interface application to manage cluster configurations and applications. Kubernetes Dashboard will be used in this post;
- CLI: command line interfaces to manage cluster configurations and applications. Kubectl will be used in this post;
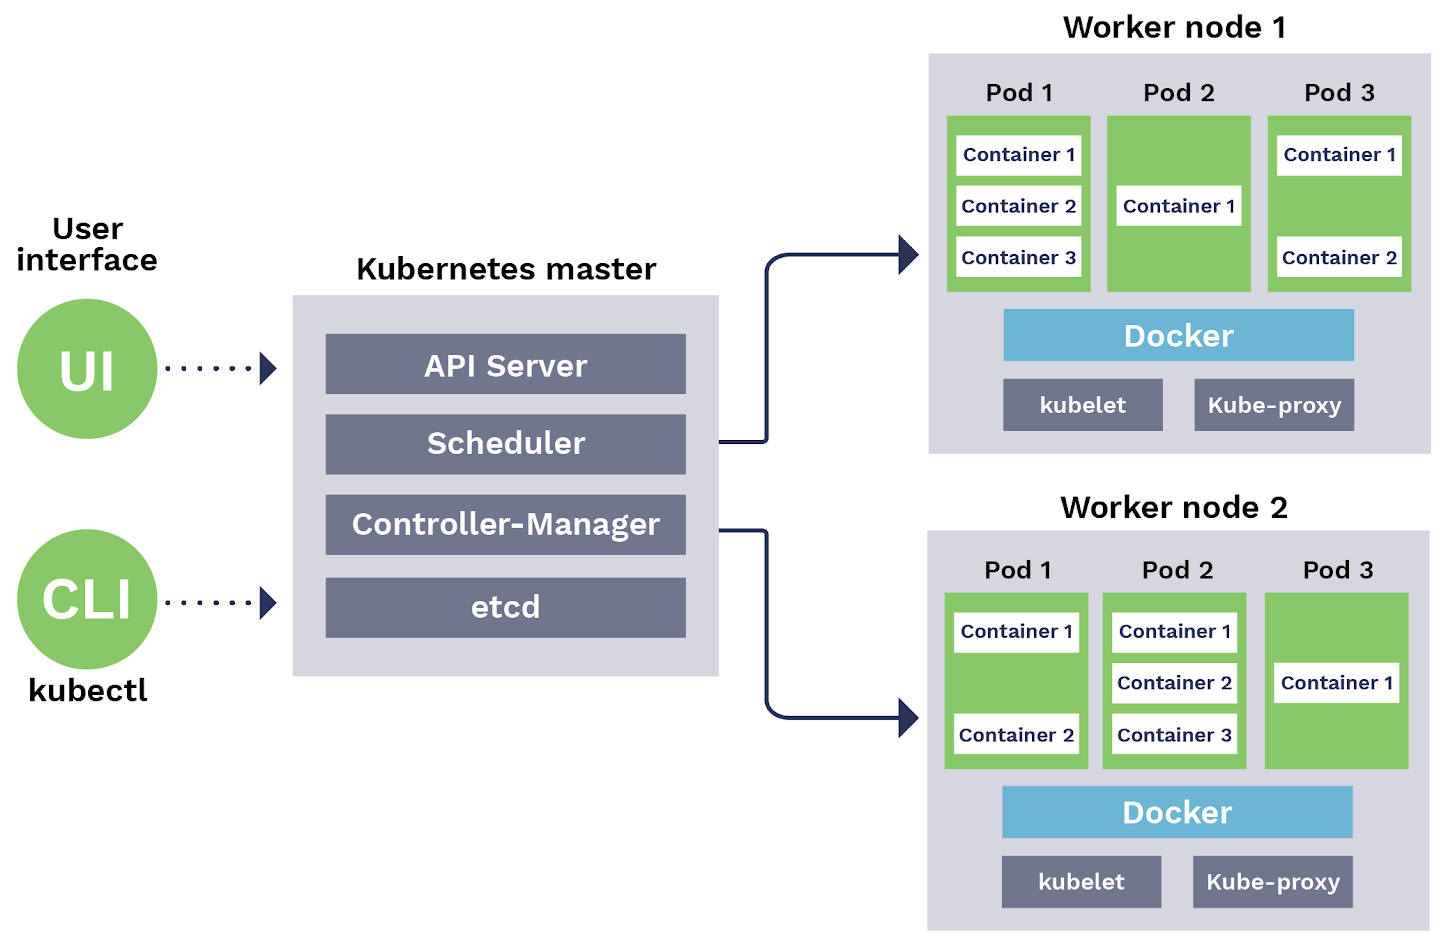 Figure: Kubernetes architecture. Source https://blog.sensu.io/how-kubernetes-works.
To learn more about Kubernetes architecture and terminology, several pages already provide an in-depth description, such as the Official Kubernetes Documentation, the introduction by Digital Ocean and the terminology presentation by Daniel Sanche.
Install
There are several options available that make the process of installing Kubernetes more straightforward, since installing and configuring every single component can be an time consuming task. Ramit Surana provides an extensive list of such installers. Special emphasis to kubeadm, kops, minikube and k3s, which are continuously supported and updated by the open source community. Since I am using MacOS and want to run Kubernetes locally in a single node, I decided to take advantage of Docker Desktop, which already provides Docker and Kubernetes installation in a single tool. After installing, one can check the system tray menu to make sure that Kubernetes is running as expected:
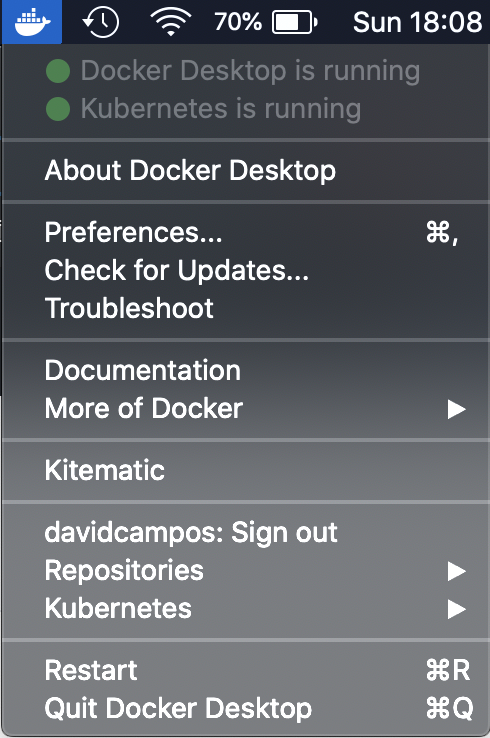 Figure: Docker Desktop.
Kubectl
Kubectl is the official CLI tool to completely manage a Kubernetes cluster, which can be used to deploy applications, inspect and manage cluster resources and view logs. Since Docker Desktop already installs kubectl, let’s just check if it is running properly by executing kubectl version, which provides an output similar to:
1
2
3
 ➜  ~ kubectl version
Client Version: version.Info{Major:"1", Minor:"15", GitVersion:"v1.15.5", GitCommit:"20c265fef0741dd71a66480e35bd69f18351daea", GitTreeState:"clean", BuildDate:"2019-10-15T19:16:51Z", GoVersion:"go1.12.10", Compiler:"gc", Platform:"darwin/amd64"}
Server Version: version.Info{Major:"1", Minor:"15", GitVersion:"v1.15.5", GitCommit:"20c265fef0741dd71a66480e35bd69f18351daea", GitTreeState:"clean", BuildDate:"2019-10-15T19:07:57Z", GoVersion:"go1.12.10", Compiler:"gc", Platform:"linux/amd64"}
In order to understand the available commands and inherent logic, I would recommend a quick overview on the official kubectl cheat sheet. For instance, one can get the list pods that are running by executing kubectl get pods.
Last but not least, if you use the ZSH shell, keep in mind to use the kubectl plugin, in order to have proper highlight and auto-completion. To achieve that, just change your ZSH ~/.zshrc init script by adding the kubectl plugin:
1
 plugins=(git kubectl)
Helm
Helm is the package manager for Kubernetes, which helps to create templates describing exactly how an application can be installed. Such templates can be shared with the community and customized for specific installations. Each template is referred as helm chart. Check Helm hub to understand if there is already a chart available for the application that you want to run. If you are curious and want to know how charts are implemented, you can also check the GitHub repository with official stable and incubated charts source code. Moreover, if you would like to have a repository for helm charts, solutions like Harbor and JFrog Artifactory can be used to store and serve your own charts.
Finally, to install helm and check if it properly installed, just run:
1
2
 brew install helm
helm version
Which should give you something like:
1
2
 ➜  ~ helm version
version.BuildInfo{Version:"v3.1.1", GitCommit:"afe70585407b420d0097d07b21c47dc511525ac8", GitTreeState:"clean", GoVersion:"go1.13.8"}
Traefik
Traefik is a widely used proxy and load balancer for HTTP and TCP applications, natively compliant and optimized for Cloud-based solutions. In summary, Traefik analyzes the infrastructure and services configuration and automatically discovers the right configuration for each one, enabling automatic applications deployment and routing. On top of this, Traefik also supports collecting detailed metrics, logs and traceability.
 Figure: Traefik architecture. Source https://docs.traefik.io.
Traefik offers a stable and official Helm chart that can be used for straightforward installation and configuration on Kubernetes. The following configuration values are provided to the chart, in order to configure:
- access to Traefik dashboard through the domain “traefik.localhost”, using the admin as username and password;
- enforce SSL for all proxied services, with automatically generated wildcard SSL certificate for the “*.localhost” domain.
1
2
3
4
5
6
7
8
9
10
11
12
 dashboard:
  enabled: true
  domain: traefik.localhost
  auth:
    basic:
      admin: $2y$05$kpCJY2gJWlgG5CUs5tdPx.2xGJ4xyqhWtjiiM/NKfHmj3pfUPsap2
ssl:
  enabled: true
  enforced: true
  permanentRedirect: true
  generateTLS: true
  defaultCN: "*.localhost"
Code: Configuration values to use with Traefik Helm chart.
After saving the configuration values in the file “traefik-values.yml”, Traefik can be installed by executing the following command:
1
 helm install stable/traefik --name traefik --values traefik-values.yml
If you would like to delete Traefik, the following command should help:
1
 helm del --purge traefik
Check installation progress by checking the status of deployments and pods:
1
2
 kubectl get deployments
kubectl get pods
When the deployment ready status is “1/1” (1 ready out of 1 required), visit http://traefik.localhost/ to access the Traefik dashboard and login with previously defined username and password. In the dashboard one can check the entry points (frontends) available to access the deployed services (backends).
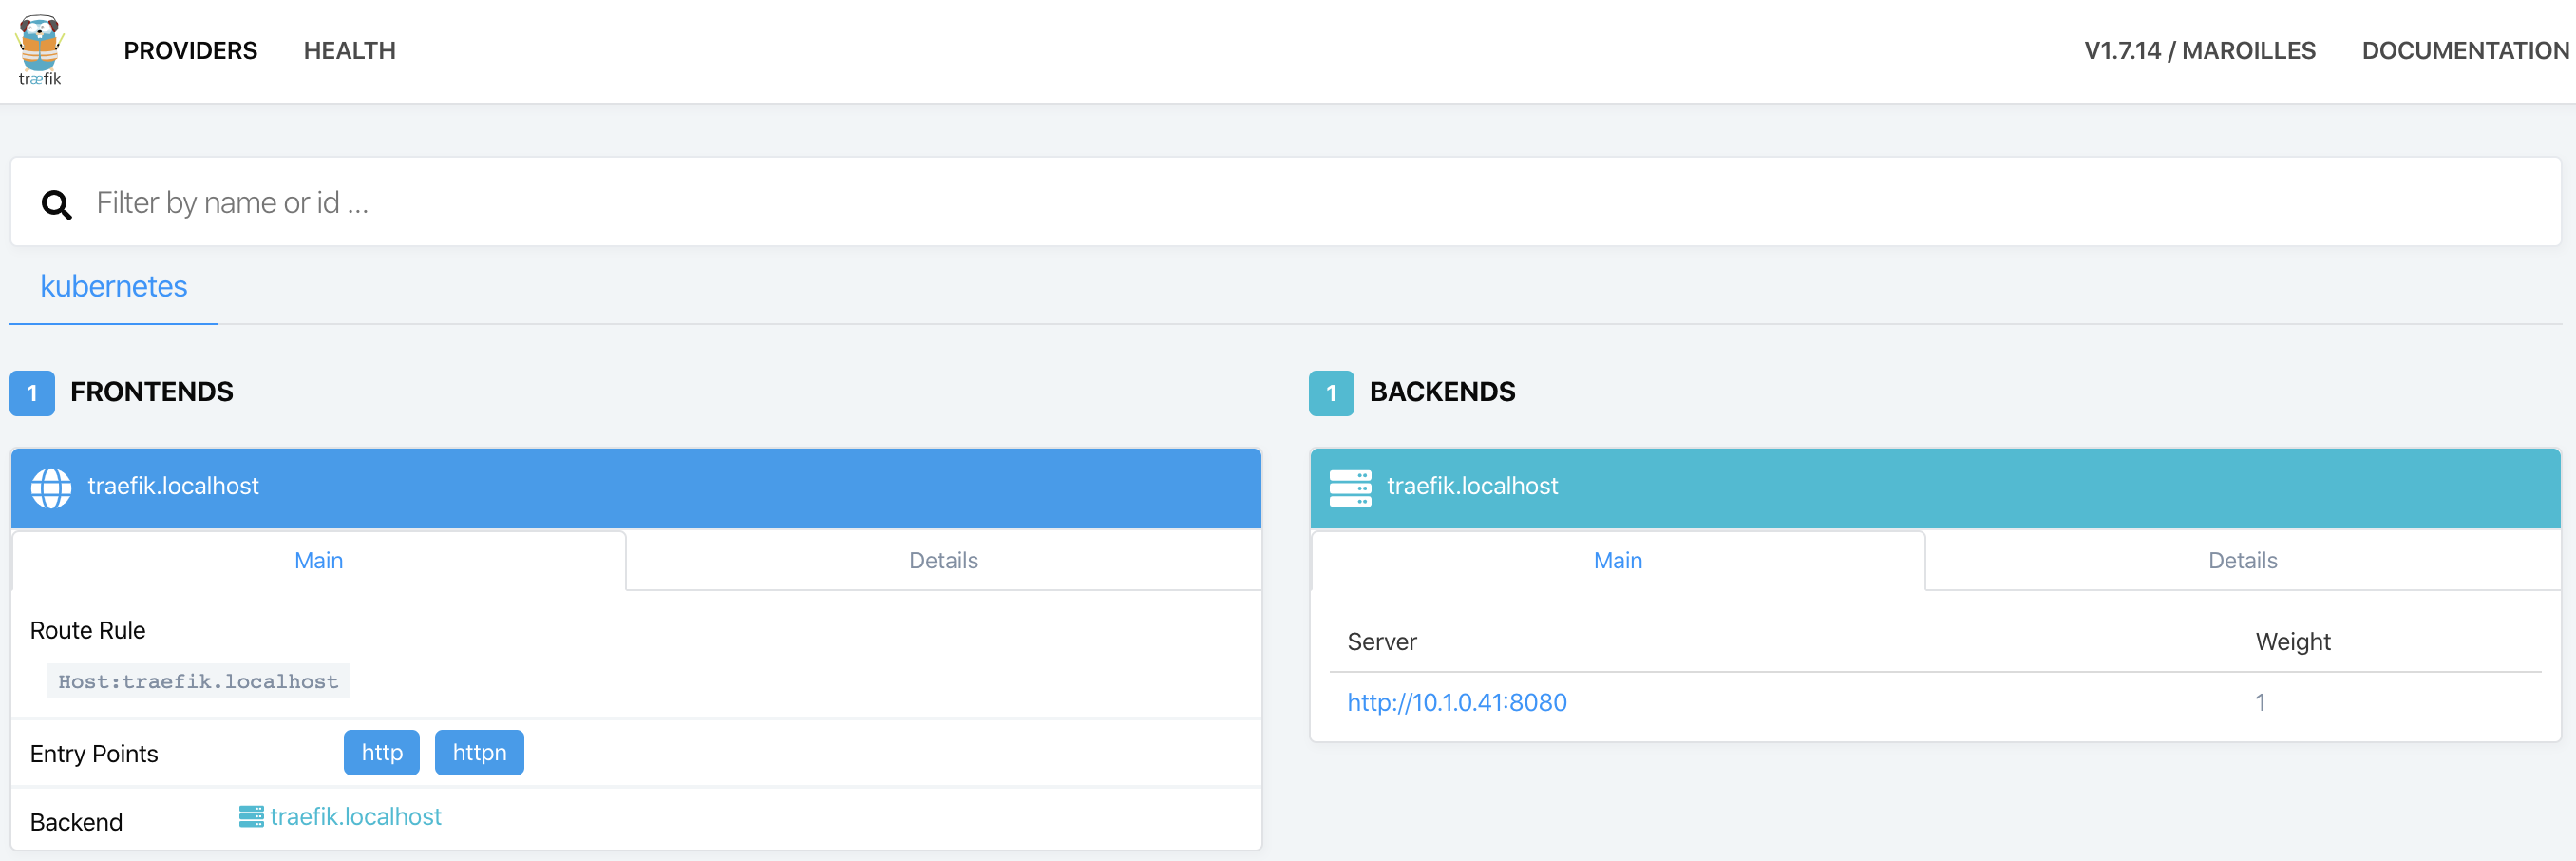 Figure: Traefik dashboard.
Kubernetes Dashboard
Kubernetes Dashboard is an open-source web interface to quickly manage a Kubernetes cluster, providing user-friendly features to manage and troubleshoot deployed applications. Personally, I prefer Portainer interface and organization, however it is still not supporting Kubernetes. Thus, the following configurations are provided to enable the Traefik ingress and make the dashboard available through http://dashboard.localhost.
1
2
3
4
5
6
7
8
9
10
11
 enableInsecureLogin: true
service:
  externalPort: 9090
ingress:
  enabled: true
  hosts:
    - dashboard.localhost
  paths:
    - /
  annotations:
    kubernetes.io/ingress.class: traefik
Code: Configuration values to use with Kubernetes Dashboard Helm chart.
Similarly to Traefik, the Dashboard can be installed using the official Kubernetes Dashboard Helm chart through the command:
1
 helm install stable/kubernetes-dashboard --name dashboard --values dashboard-values.yml
In order to login, the helm chart already creates a service account with the appropriate permissions. The token to login with such service account is available in kubernetes secrets. To get the list of available secrets just run kubectl get secrets:
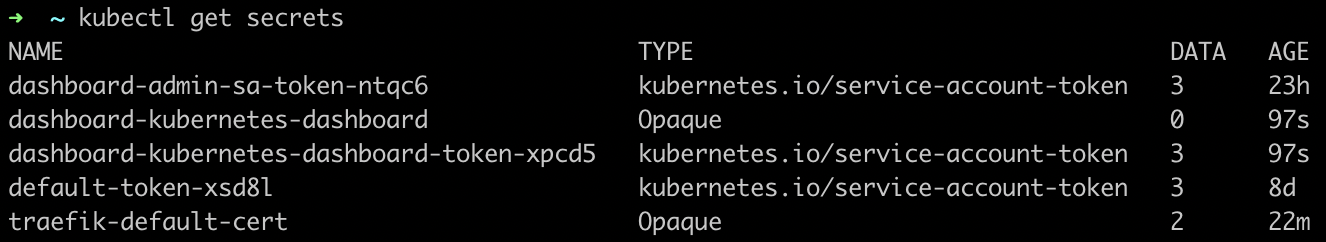 Figure: Kubernetes secrets.
To get the secret value, lets describe the secret that contains the dashboard token with kubectl describe secrets dashboard-kubernetes-dashboard-token-sk68z:
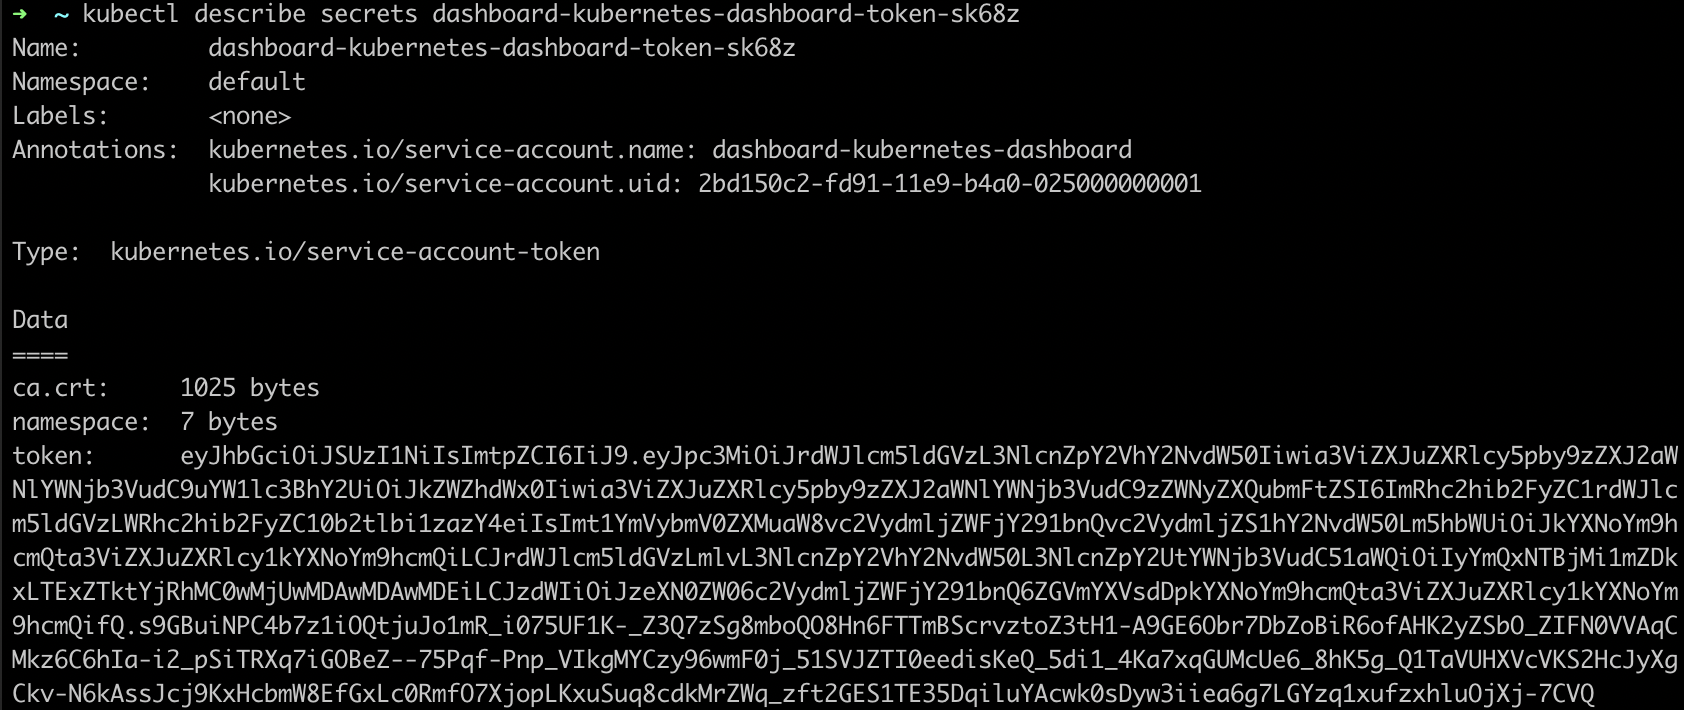 Figure: Kubernetes secret with token.
Finally, go to http://dashboard.localhost, and use the previous token value to login in the Kubernetes Dashboard:
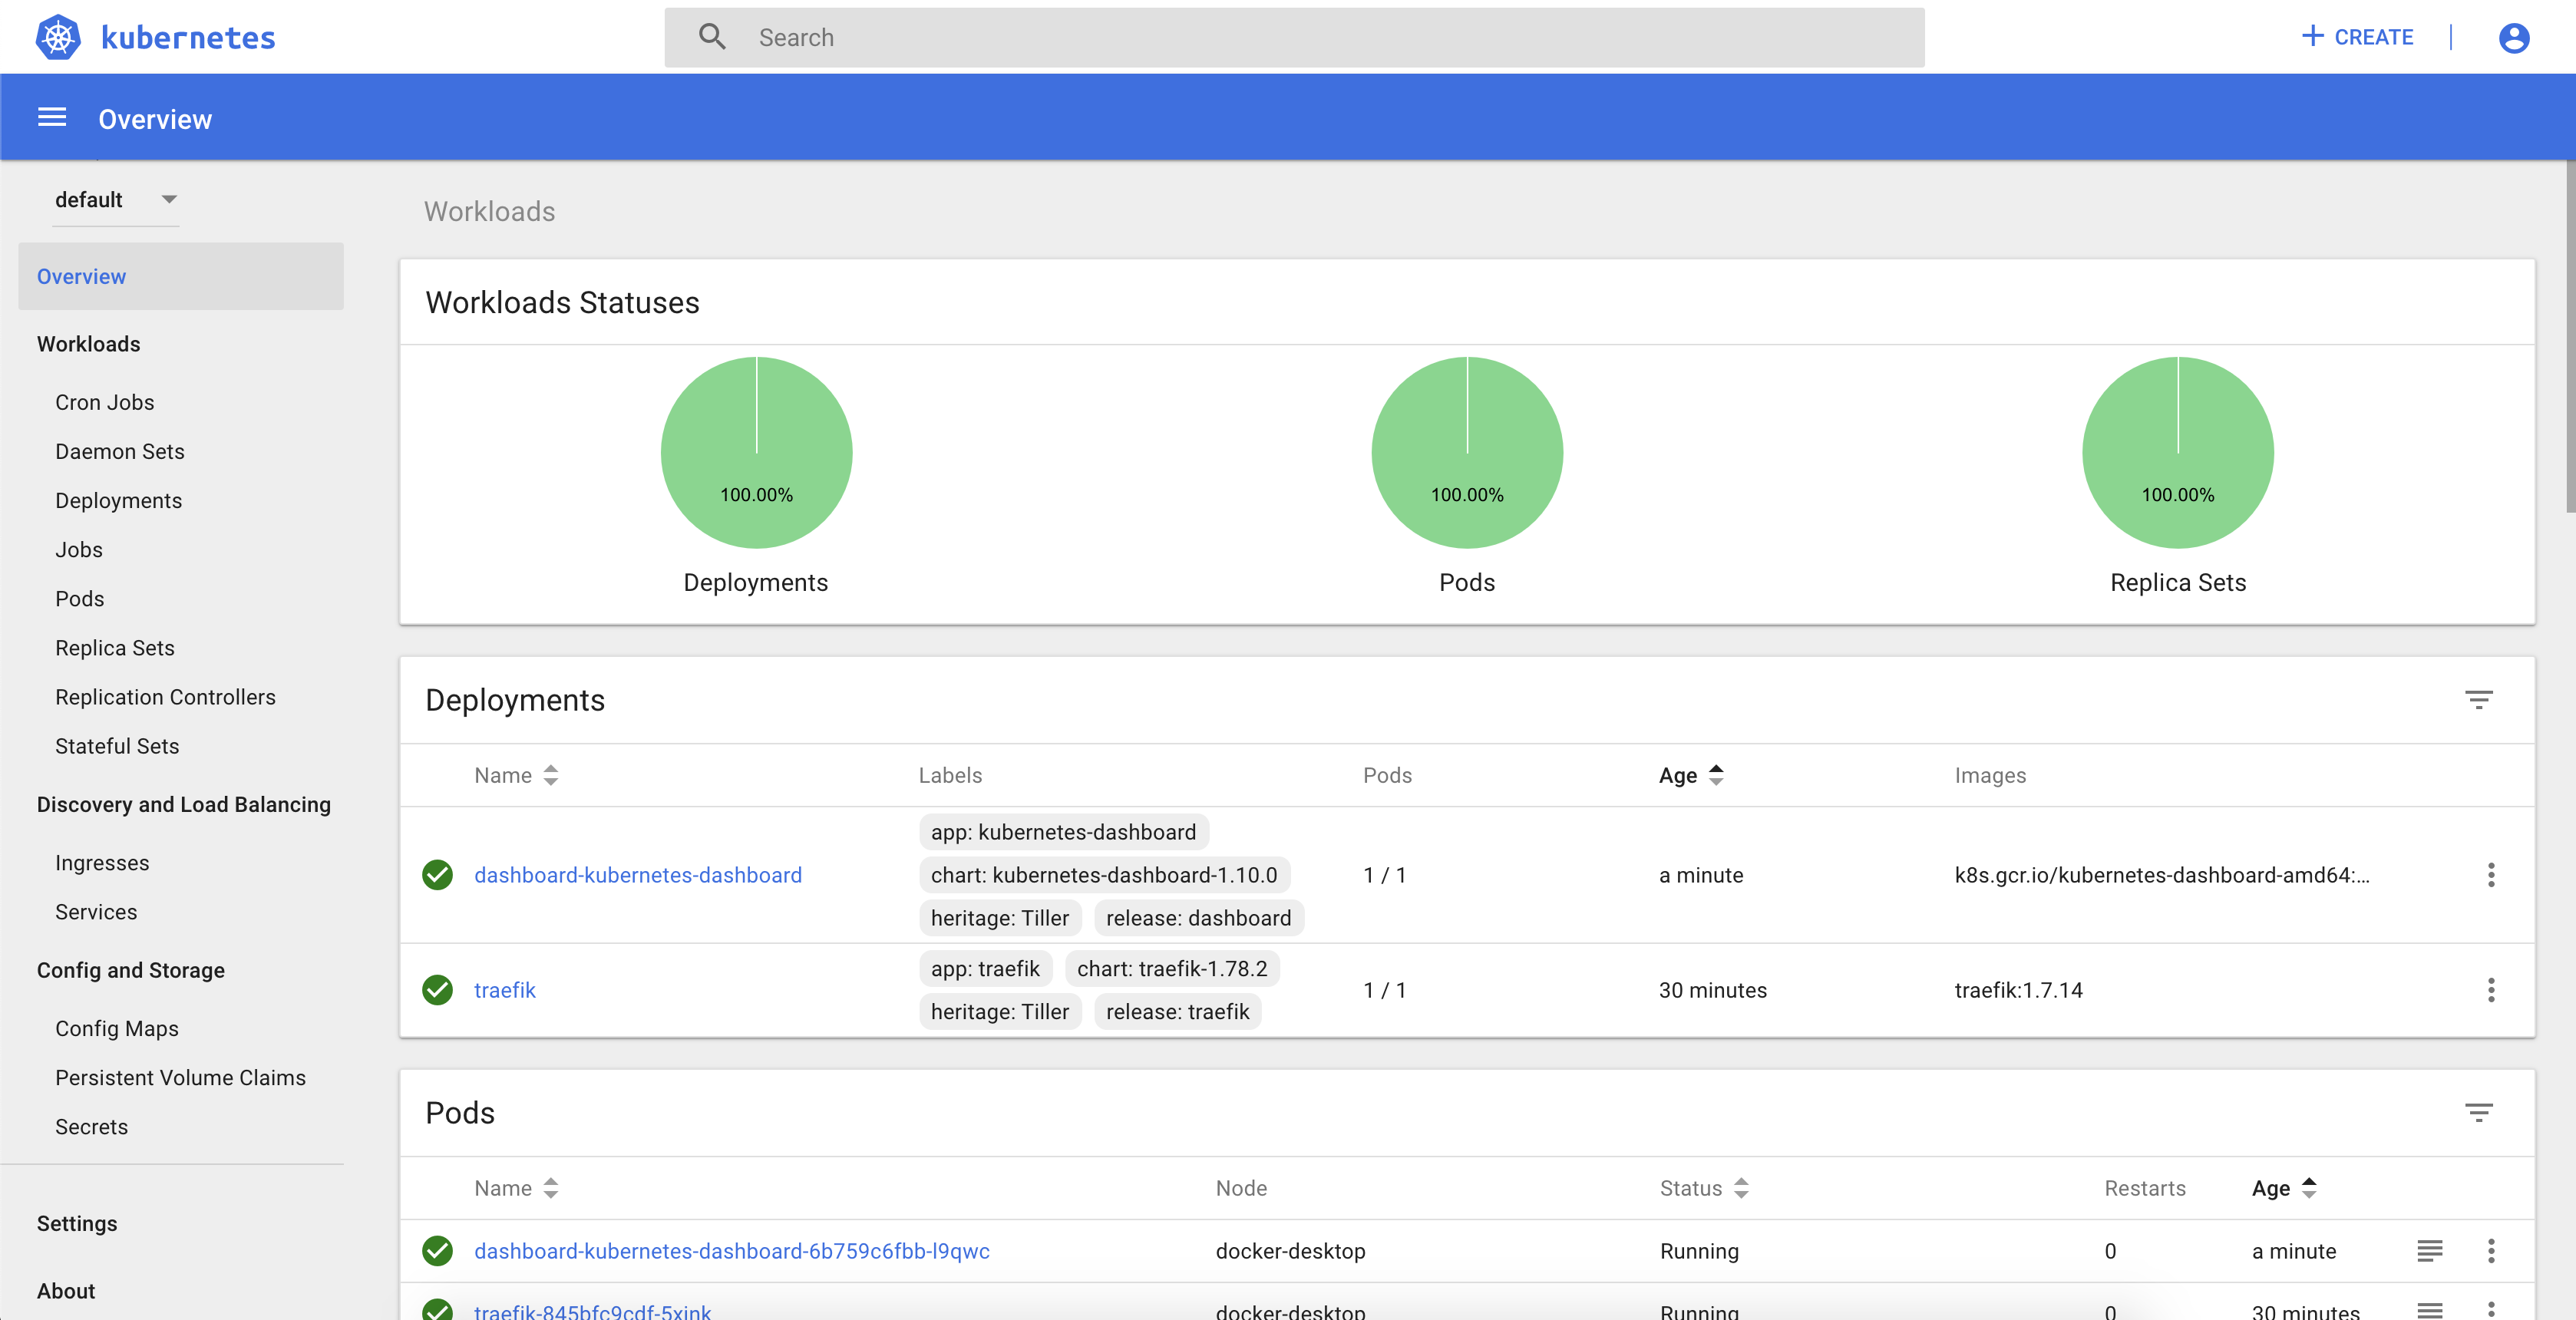 Figure: Kubernetes Dashboard.
Jenkins
Jenkins is the most widely used open-source tool to automatically build, test and deploy software applications. Thus, with Jenkins we can specify a processing pipeline describing exactly how our application will be built and deployed automatically after each commit.
To install Jenkins, we will take advantage of the official Jenkins Helm chart, providing the following configurations to specify login credentials and install the plugins to integrate with GitHub and Kubernetes:
1
2
3
4
5
6
7
8
9
10
11
12
13
14
15
16
17
18
19
20
21
 master:
  useSecurity: true
  adminUser: admin
  adminPassword: admin
  numExecutors: 1
  installPlugins:
    - kubernetes:1.21.1
    - workflow-job:2.36
    - workflow-aggregator:2.6
    - credentials-binding:1.20
    - git:3.12.1
    - command-launcher:1.3
    - github-branch-source:2.5.8
    - docker-workflow:1.21
    - pipeline-utility-steps:2.3.1
  overwritePlugins: true
  ingress:
    enabled: true
    hostName: jenkins.localhost
    annotations:
      kubernetes.io/ingress.class: traefik
Code: Configuration values to use with Jenkins Helm chart.
To perform installation, execute the following command and check the progress with kubectl get deployments:
1
 helm install stable/jenkins --name jenkins --values jenkins-values.yml
When required pods are running, go to http://jenkins.localhost to access Jenkins and login with the previously provided credentials:
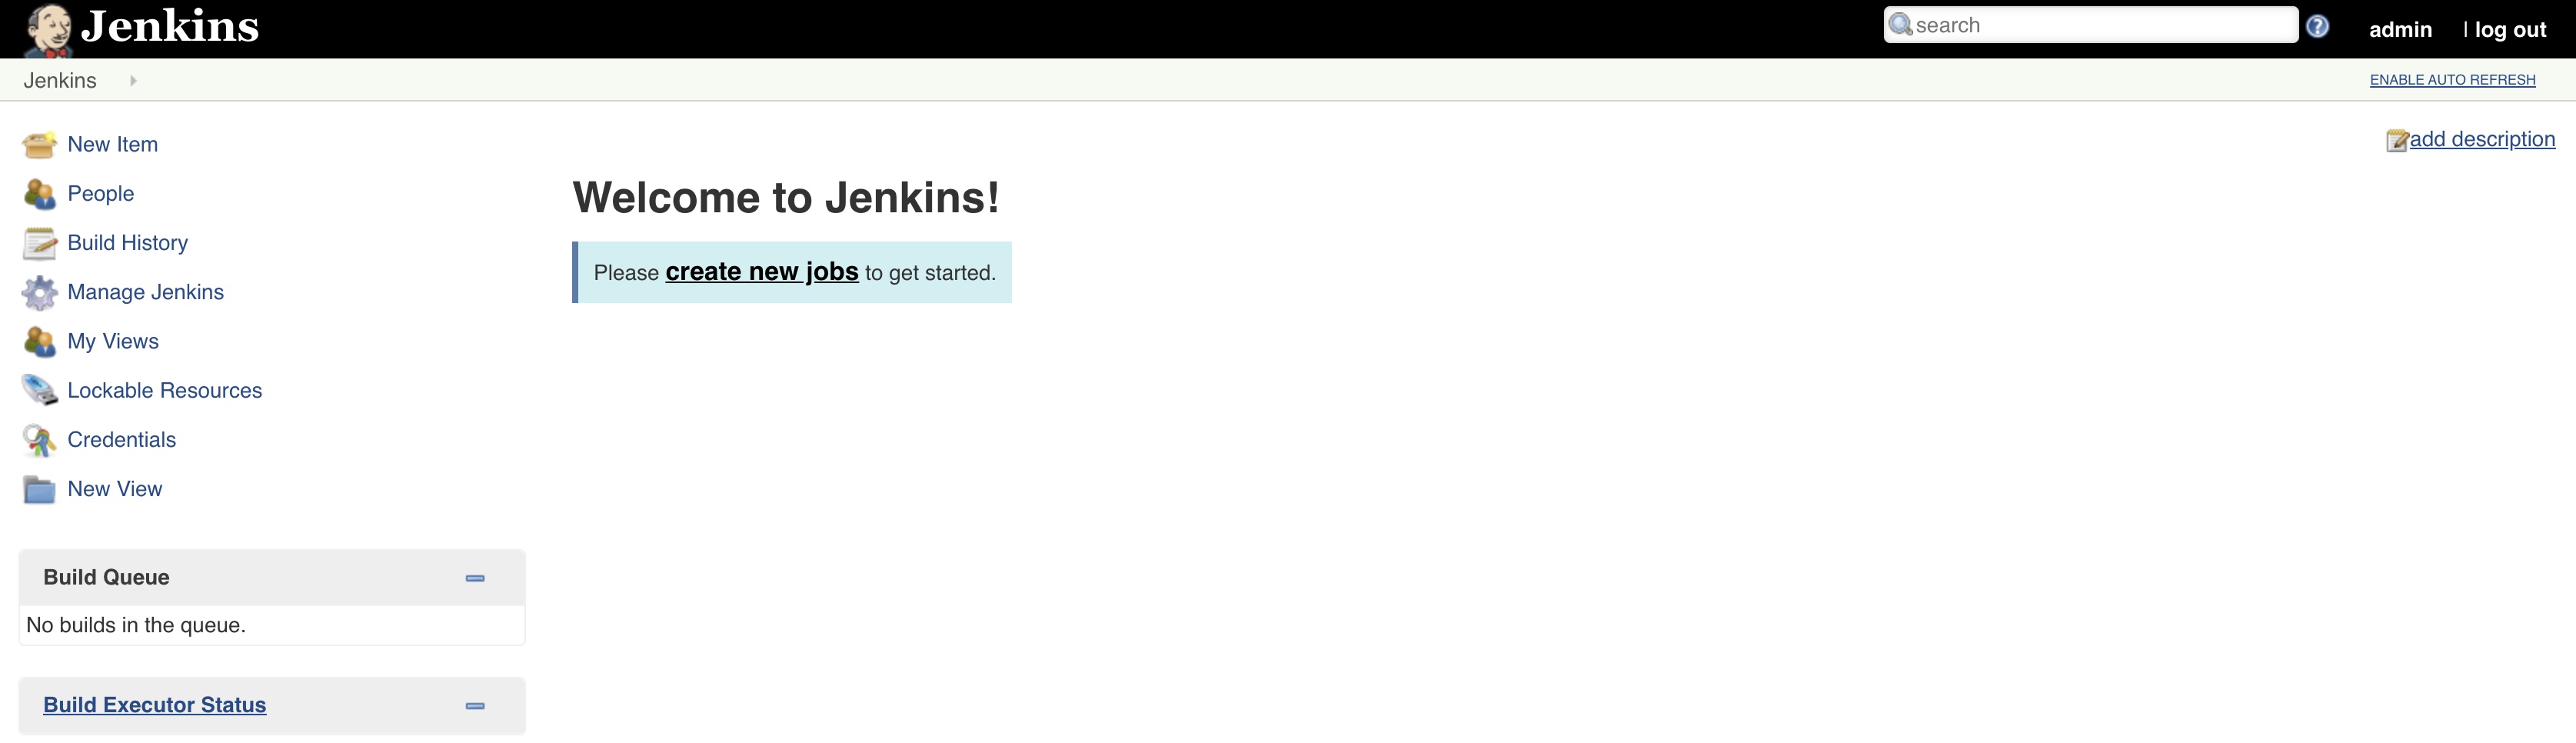 Figure: Jenkins Dashboard.
Application
Since all required tools are installed and running successfully, we are now ready to create the sample application to be built and deployed automatically. Such application will be developed in Kotlin using the Spring Boot framework. Spring Initializr is used to create the initial application, using the following configurations:
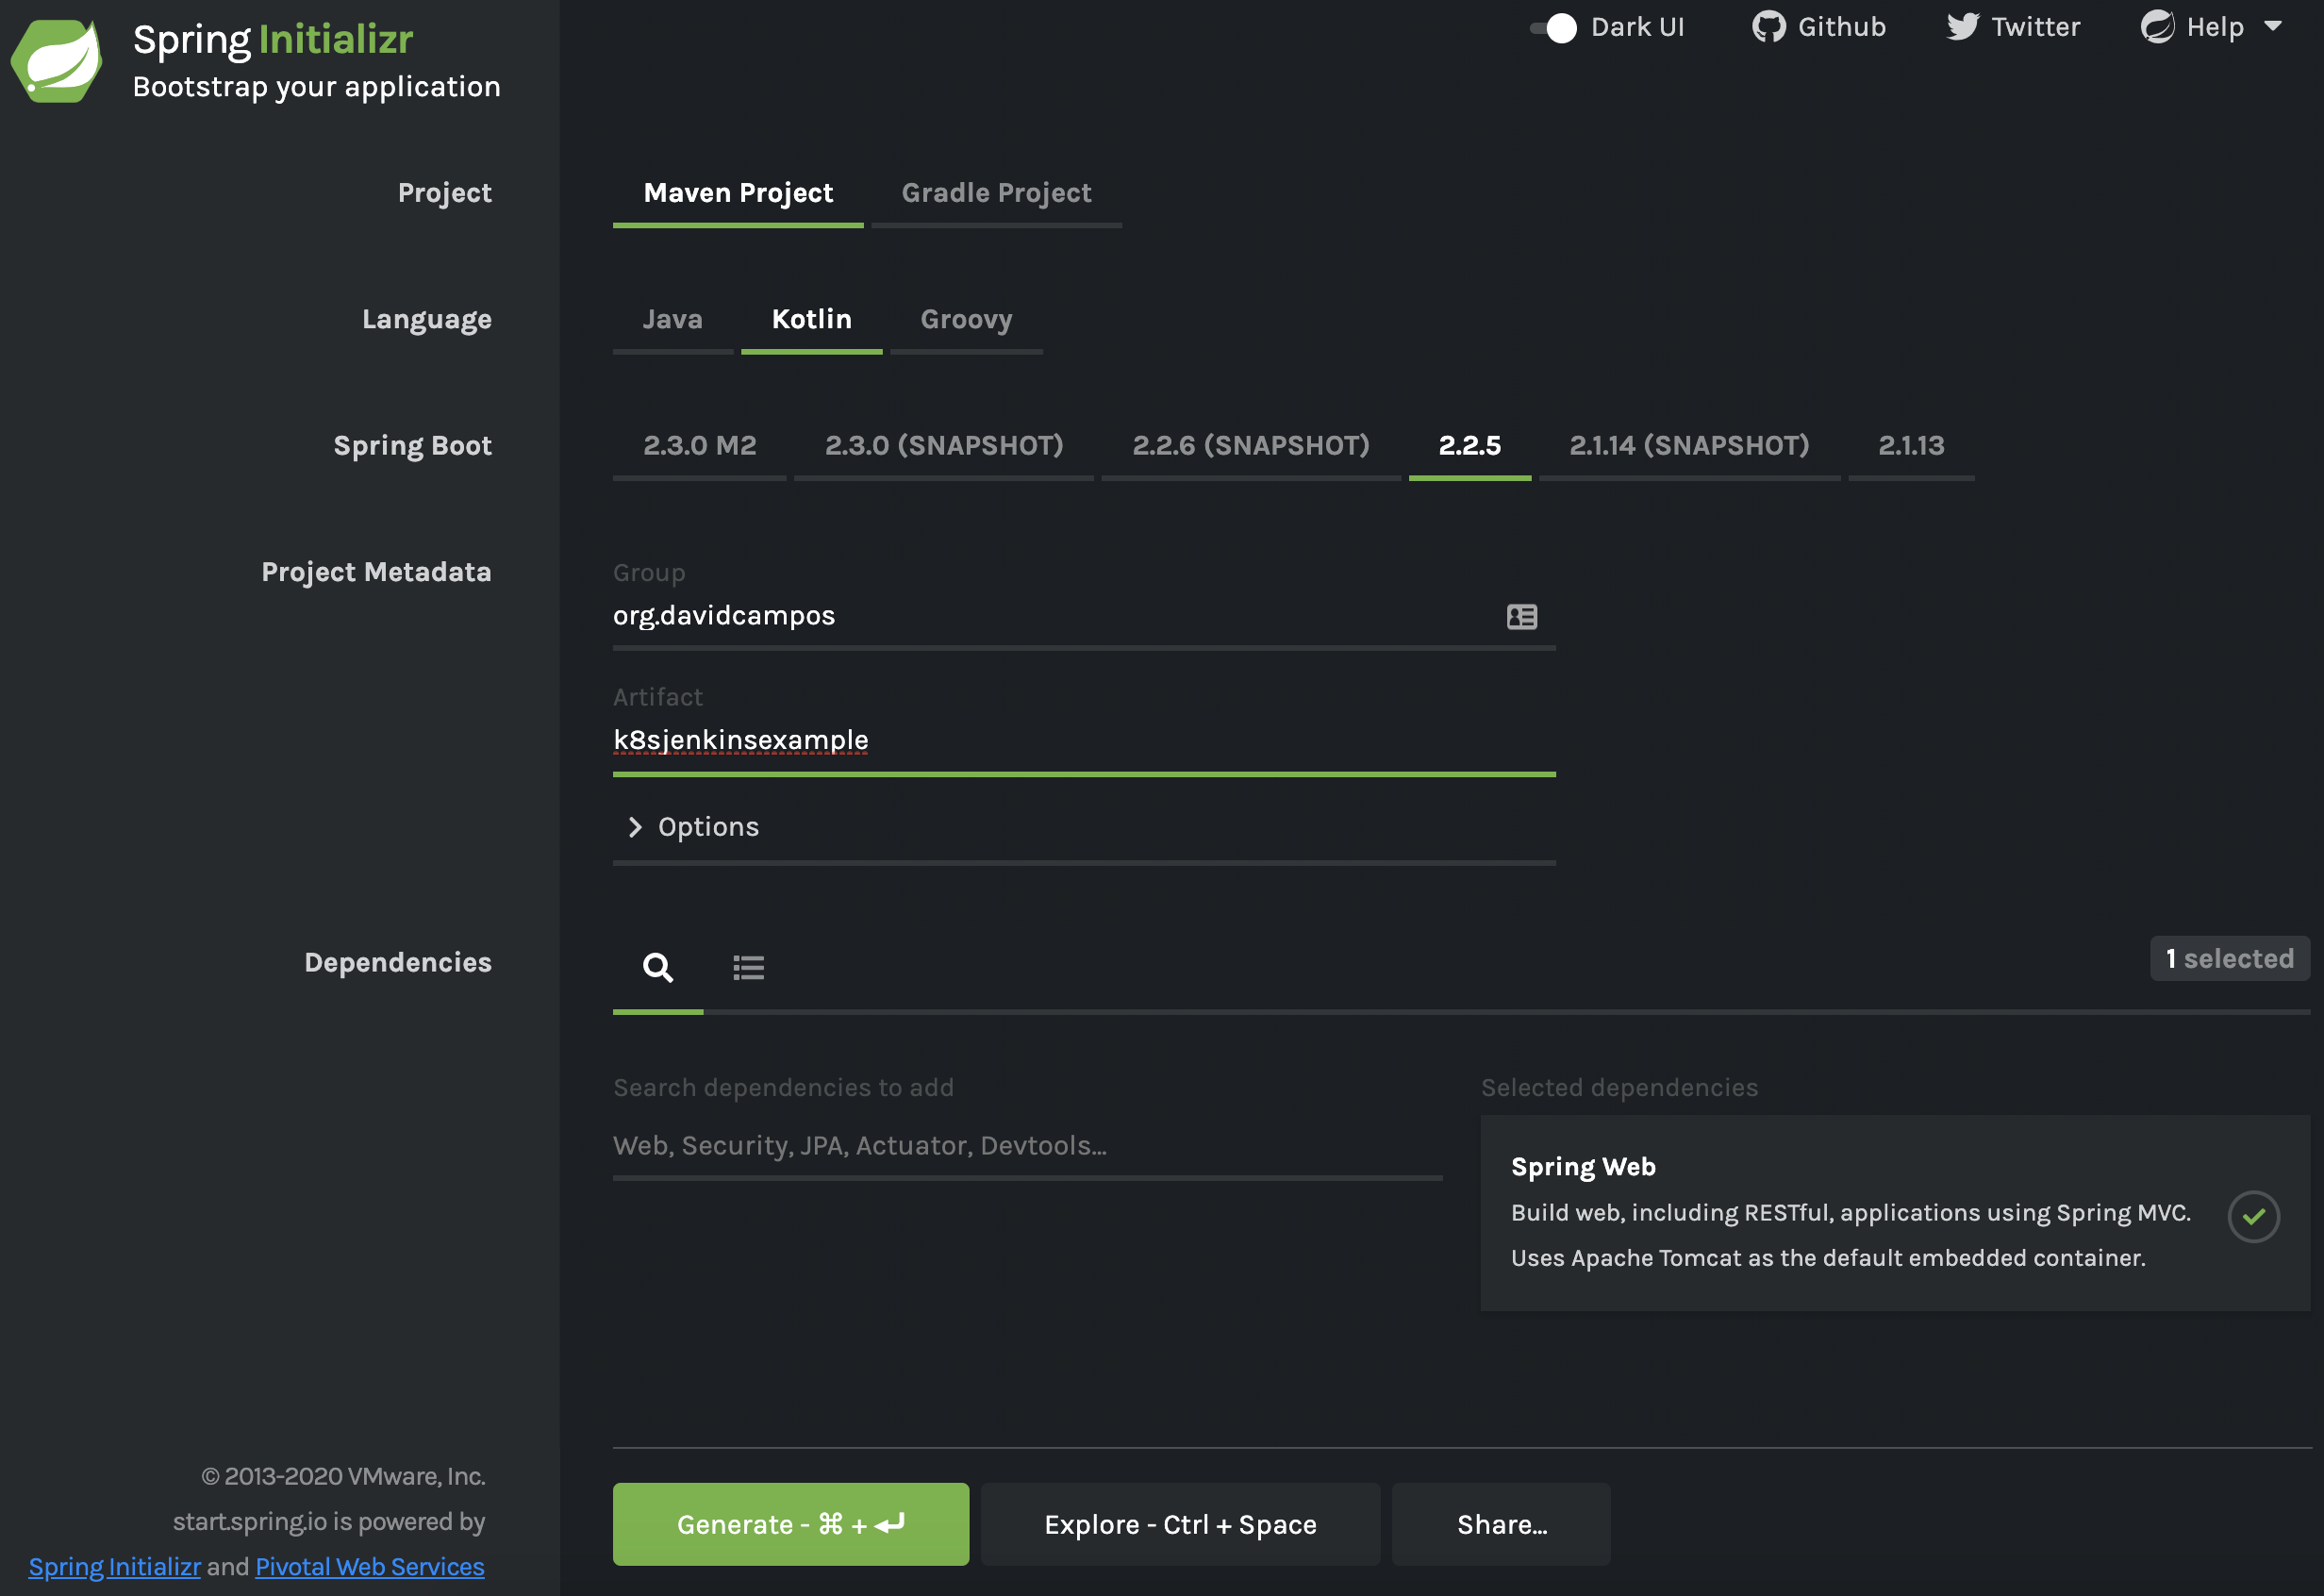 Figure: Spring Initializr configuration.
The core functionality will be in the GreetingController, which simply provides a GET REST endpoint to provide a greeting based on input argument, provided environment variable and overall counter to differentiate between different calls.
1
2
3
4
5
6
7
8
9
10
 @RestController
class GreetingController {
    val counter = AtomicLong()

    @GetMapping("/greeting")
    fun greeting(@RequestParam(value = "name", defaultValue = "World") name: String): Greeting {
        val envVar: String = System.getenv("EXAMPLE_VALUE") ?: "default_value"
        return Greeting(counter.incrementAndGet(), "Hello, $name", envVar)
    }
}
Additionally, keep in mind to add the actuator dependency to enable the health endpoint at /actuator/health, which will be used to provide application health information to Kubernetes:
1
2
3
4
 <dependency>
    <groupId>org.springframework.boot</groupId>
    <artifactId>spring-boot-starter-actuator</artifactId>
</dependency>
Dockerfile
To run the application in Kubernetes, a Docker image of the application is required, which can be described with the following Dockerfile:
1
2
3
4
 FROM openjdk:8-jdk-alpine
EXPOSE 8090
ADD /target/k8s-jenkins-example*.jar k8s-jenkins-example.jar
ENTRYPOINT ["java", "-jar", "k8s-jenkins-example.jar"]
Helm chart
To create the helm chart for the sample application, one can take advantage of the helm CLI tool to create a baseline that we can adapt for the sample application. Such baseline can be created by running helm create helm on your terminal, which creates the templates of the required Kubernetes components to run and properly configure the application. Considering our goal, the following files are the ones that require most attention:
-
Chart.yaml: chart properties such as name, description and version; -
values.yaml: default configuration values provided to chart; -
templates/deplyment.yaml: template of Kubernetes deployment specification, to configure the application pod and replication characteristics; -
templates/service.yaml: template of Kubernetes service specification, to configure the application interface for other applications; -
templates/ingress.yaml: template of Kubernetes ingress specification, to expose service for external access.
Helm charts use ` {{}} ` for templating, which means that whatever that is inside will be interpreted to provide an output value. More details on several templating options in the official guide. For the template that we are creating, the following are the most important examples:
- ` {{ .Values.replicaCount }} ` to get configuration
replicaCountfrom provided values file; -
` {{- toYaml . nindent 8 }} `: copies the referred yaml tree (dot refers to the current structure reference) into outcome with an indent of 8 white spaces.
The following values were defined to configure the application, which will be used in the chart templates. Important to refer the provided docker image reference, the service port and the ingress configuration to use Traefik:
1
2
3
4
5
6
7
8
9
10
11
12
13
14
15
16
17
18
19
20
21
 image:
  repository: davidcampos/k8s-jenkins-example
  tag: latest
  pullPolicy: Always

name: "example"
domain: "localhost"

replicaCount: 1

service:
  port: 8090

ingress:
  enabled: true
  annotations:
    kubernetes.io/ingress.class: traefik
  hosts:
    - host:
      paths:
        - /
Code: Helm chart configuration values.
Below you can find the deployment template, which configures the replica set and how it should be updated, sets up the container together with health probes, and finally specifies where the pods should be deployed:
1
2
3
4
5
6
7
8
9
10
11
12
13
14
15
16
17
18
19
20
21
22
23
24
25
26
27
28
29
30
31
32
33
34
35
36
37
38
39
40
41
42
43
44
45
46
47
48
49
50
51
52
53

apiVersion: extensions/v1beta1
kind: Deployment
metadata:
  name: {{ .Values.name }}-deployment
spec:
  replicas: {{ .Values.replicaCount }}
  revisionHistoryLimit: 2
  selector:
    matchLabels:
      app: {{ .Values.name }}
  strategy:
    type: RollingUpdate
    rollingUpdate:
      maxUnavailable: 1
      maxSurge: 1
  template:
    metadata:
      labels:
        app: {{ .Values.name }}
        role: rolling-update
    spec:
    {{- with .Values.imagePullSecrets }}
      imagePullSecrets:
        {{- toYaml . | nindent 8 }}
    {{- end }}
      containers:
        - name: {{ .Values.name }}-container
          image: "{{ .Values.image.repository }}:{{ .Values.image.tag }}"
          imagePullPolicy: {{ .Values.image.pullPolicy }}
          livenessProbe:
            httpGet:
              path: /actuator/health
              port: {{ .Values.service.port }}
          readinessProbe:
            httpGet:
              path: /actuator/health
              port: {{ .Values.service.port }}
          resources:
            {{- toYaml .Values.resources | nindent 12 }}
      {{- with .Values.nodeSelector }}
      nodeSelector:
        {{- toYaml . | nindent 8 }}
      {{- end }}
    {{- with .Values.affinity }}
      affinity:
        {{- toYaml . | nindent 8 }}
    {{- end }}
    {{- with .Values.tolerations }}
      tolerations:
        {{- toYaml . | nindent 8 }}
    {{- end }}
Code: Helm chart deployment template.
The following template provides the service configuration, which refers to the port provided in the deployment:
1
2
3
4
5
6
7
8
9
10
11
12
13

apiVersion: v1
kind: Service
metadata:
  name: {{ .Values.name }}-service
spec:
  ports:
    - name: http
      targetPort: {{ .Values.service.port }}
      port: {{ .Values.service.port }}
  selector:
    app: {{ .Values.name }}
Code: Helm chart service template.
Finally, the ingress template configures how the service is exposed for external access, specifying matching rules and TLS properties:
1
2
3
4
5
6
7
8
9
10
11
12
13
14
15
16
17
18
19
20
21
22
23
24
25
26
27
28
29
30
31
32
33
34
35
36
37

{{- if .Values.ingress.enabled -}}
{{- $name := .Values.name -}}
{{- $hostname := printf "%s.%s" .Values.name .Values.domain -}}
apiVersion: extensions/v1beta1
kind: Ingress
metadata:
  name: {{ $name }}-ingress
  {{- with .Values.ingress.annotations }}
  annotations:
    {{- toYaml . | nindent 4 }}
  {{- end }}
spec:
{{- if .Values.ingress.tls }}
  tls:
  {{- range .Values.ingress.tls }}
    - hosts:
      {{- range .hosts }}
        - {{ $hostname | quote}}
      {{- end }}
      secretName: {{ .secretName }}
  {{- end }}
{{- end }}
  rules:
  {{- range .Values.ingress.hosts }}
    - host: {{ $hostname | quote }}
      http:
        paths:
        {{- range .paths }}
          - path: {{ . }}
            backend:
              serviceName: {{ $name }}-service
              servicePort: http
        {{- end }}
  {{- end }}
{{- end }}
Code: Helm chart ingress template.
In order to check if the helm chart is working properly, we can install it and check if the several components where deployed properly:
1
2
3
4
5
 helm install example ./helm
kubectl get deployment
kubectl get pod
kubectl get service
kubectl get ingress
Pipeline
The goal is to build the pipeline taking full advantage of Kubernetes, building the required artifacts on dedicated agents executed on-demand. Such approach provides high flexibility and independency for developers, which are in full control of their building pipelines and without dependencies to whatever is installed on the Jenkins host machine. As a result, the Jenkins machine will not be polluted with many different tools and versions. For instance, if one team needs Java 8 and another needs Java 13, the Jenkins host machine does not need to have both installed, since each team pipeline will run on its own Jenkins agent that is deployed on-demand for each run. To achieve that, we used the Kubernetes Jenkins plugin, which allows to define a pod with containers with required tools. Then, we just have to mention that we want to run a specific step inside a specific container by referencing its name.
Keep in mind that a workspace volume is automatically created and shared between containers in the pod, which means that any change on the workspace will be available for other containers. For instance, if we use the maven container to create the packaged jar file, it will be available for the docker container to create the docker image. Moreover, in order to speed up the building process, do not forget to create a volume for the maven ~/.m2 folder, in order to share downloaded dependencies between job runs.
Since maven, docker and helm tools are required to properly build and deploy the sample application, the following pod specification is provided in the build.yaml file:
1
2
3
4
5
6
7
8
9
10
11
12
13
14
15
16
17
18
19
20
21
22
23
24
25
26
27
28
29
30
31
32
33
34
35
36
 apiVersion: v1
kind: Pod
metadata:
  labels:
    some-label: pod
spec:
  containers:
    - name: maven
      image: maven:3.3.9-jdk-8-alpine
      command:
        - cat
      tty: true
      volumeMounts:
        - name: m2
          mountPath: /root/.m2
    - name: docker
      image: docker:19.03
      command:
        - cat
      tty: true
      privileged: true
      volumeMounts:
        - name: dockersock
          mountPath: /var/run/docker.sock
    - name: helm
      image: lachlanevenson/k8s-helm:v3.1.1
      command:
        - cat
      tty: true
  volumes:
    - name: dockersock
      hostPath:
        path: /var/run/docker.sock
    - name: m2
      hostPath:
        path: /root/.m2
Before jumping into the pipeline, we need to define the credentials that will be used to access GitHub source code and Docker Hub images. Such credentials can be stored on Jenkins credentials, which later can be referenced from the pipeline using respective identifiers:
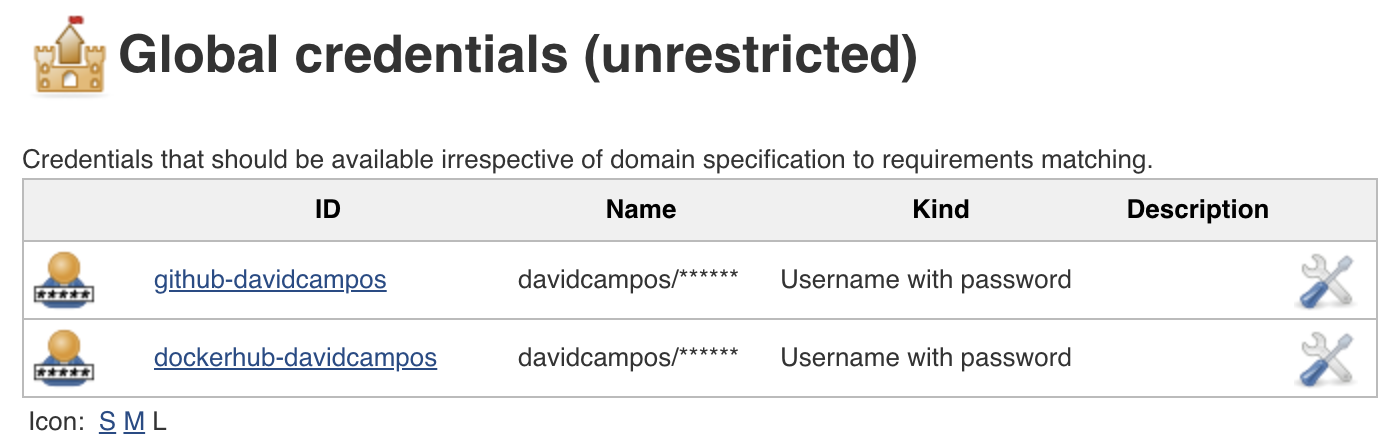 Figure: Jenkins credentials.
For the pipeline I decided to use the declarative syntax instead of scripted, which is a better fit for simple pipelines and easier to read and understand. However, the more restrictive syntax can be a limitation if we want to perform more advanced tasks. For such cases, a script block can be defined in a declarative pipeline. In summary, the CI/CD declarative pipeline for the sample application will have the following stages:
- Build: build application package using maven;
- Docker Build: build docker image using previously created Dockerfile;
- Docker Publish: publish built docker image to Docker Hub;
- Kubernetes Deploy: deploy application using previously created helm chart, by installing or upgrading respective Kubernetes components.
On top of the stages, two different deployment environments will be created: production (https://example.localhost) and staging (https://example-staging.localhost), which are related with master and develop branches respectively. Thus, if the branch is not master or develop, the docker image is not built and the application is not deployed to Kubernetes. Moreover, all application artifacts have the same version, which is loaded from the POM file using the Pipeline Utility steps Jenkins library.
Find below the Jenkins declarative pipeline for the sample application, which also setups the agent using the pod described on the build.yaml file and automatically checkouts the source code from GitHub on each job run:
1
2
3
4
5
6
7
8
9
10
11
12
13
14
15
16
17
18
19
20
21
22
23
24
25
26
27
28
29
30
31
32
33
34
35
36
37
38
39
40
41
42
43
44
45
46
47
48
49
50
51
52
53
54
55
56
57
 pipeline {
    environment {
        DEPLOY = "${env.BRANCH_NAME == "master" || env.BRANCH_NAME == "develop" ? "true" : "false"}"
        NAME = "${env.BRANCH_NAME == "master" ? "example" : "example-staging"}"
        VERSION = readMavenPom().getVersion()
        DOMAIN = 'localhost'
        REGISTRY = 'davidcampos/k8s-jenkins-example'
        REGISTRY_CREDENTIAL = 'dockerhub-davidcampos'
    }
    agent {
        kubernetes {
            defaultContainer 'jnlp'
            yamlFile 'build.yaml'
        }
    }
    stages {
        stage('Build') {
            steps {
                container('maven') {
                    sh 'mvn package'
                }
            }
        }
        stage('Docker Build') {
            when {
                environment name: 'DEPLOY', value: 'true'
            }
            steps {
                container('docker') {
                    sh "docker build -t ${REGISTRY}:${VERSION} ."
                }
            }
        }
        stage('Docker Publish') {
            when {
                environment name: 'DEPLOY', value: 'true'
            }
            steps {
                container('docker') {
                    withDockerRegistry([credentialsId: "${REGISTRY_CREDENTIAL}", url: ""]) {
                        sh "docker push ${REGISTRY}:${VERSION}"
                    }
                }
            }
        }
        stage('Kubernetes Deploy') {
            when {
                environment name: 'DEPLOY', value: 'true'
            }
            steps {
                container('helm') {
                    sh "helm upgrade --install --force --set name=${NAME} --set image.tag=${VERSION} --set domain=${DOMAIN} ${NAME} ./helm"
                }
            }
        }
    }
}
Job
To finalize, let’s create the Jenkins job to run the pipeline using the sample application source code. To achieve that, go to Jenkins and create a new Multibranch Pipeline job with the following configurations:
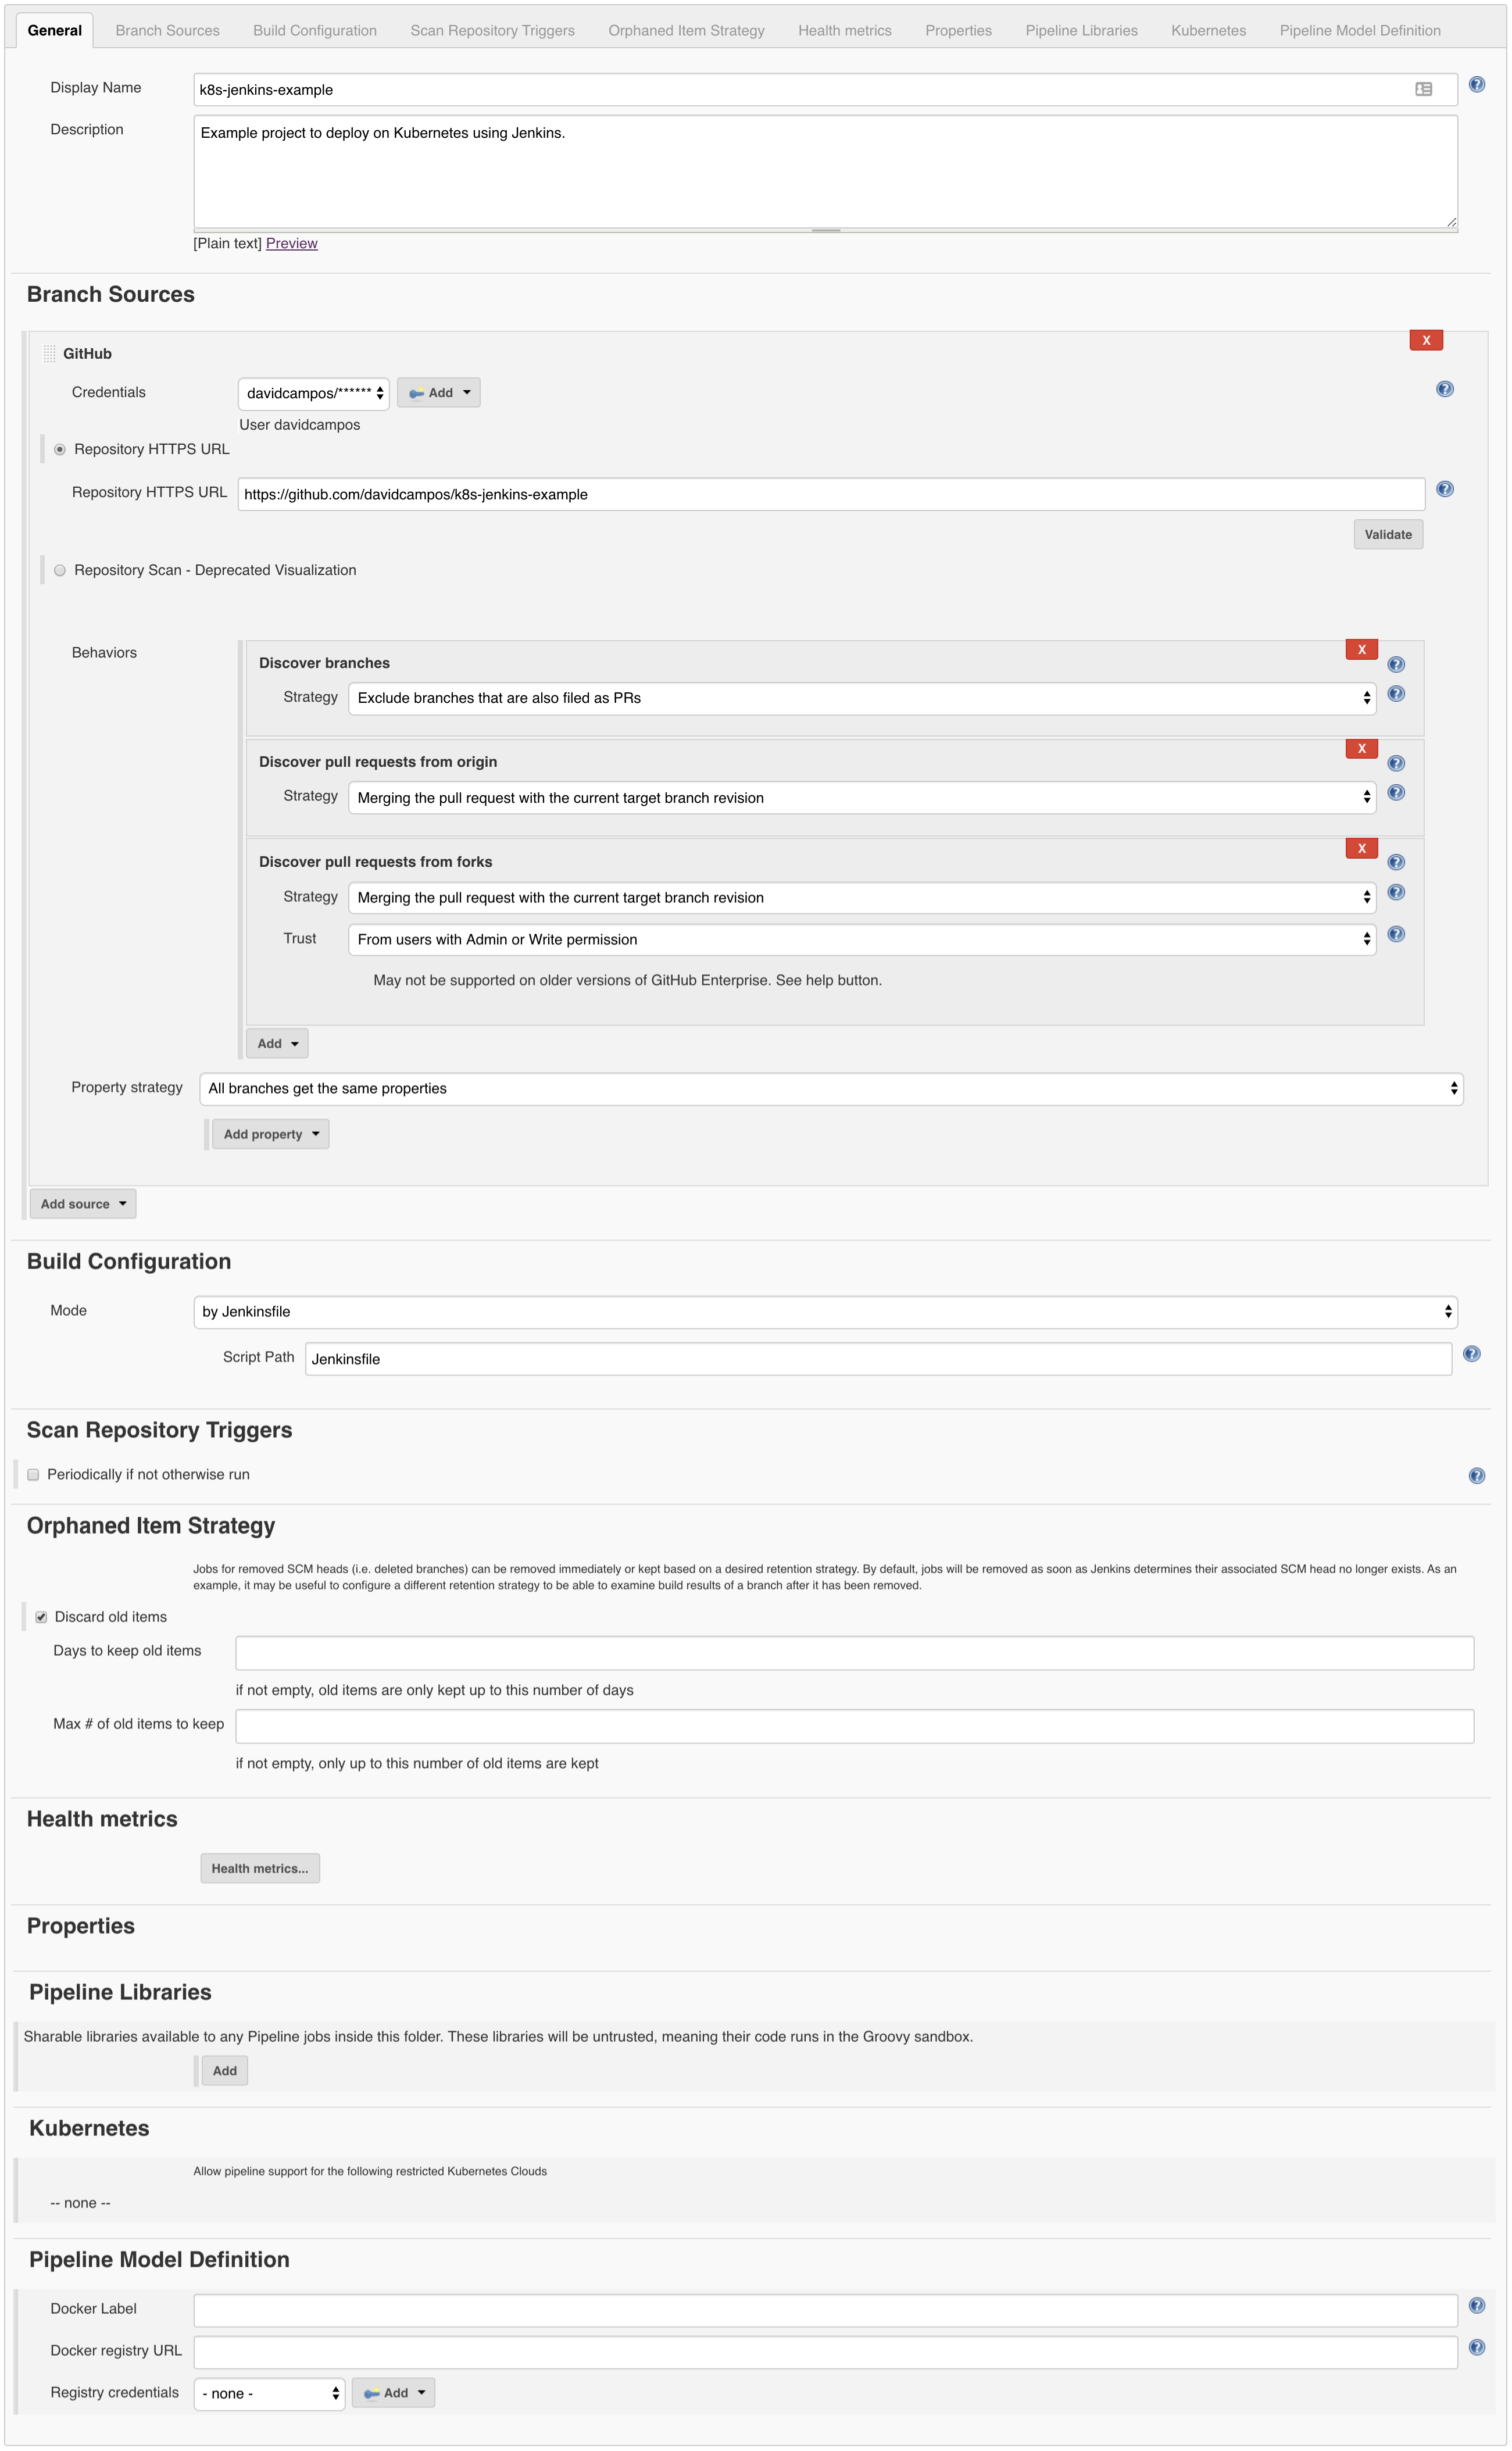 Figure: Jenkins job configuration.
After saving the Jenkins job, you should be able to see it in the list, explore its several branches, and check the pipelines executed for each one:
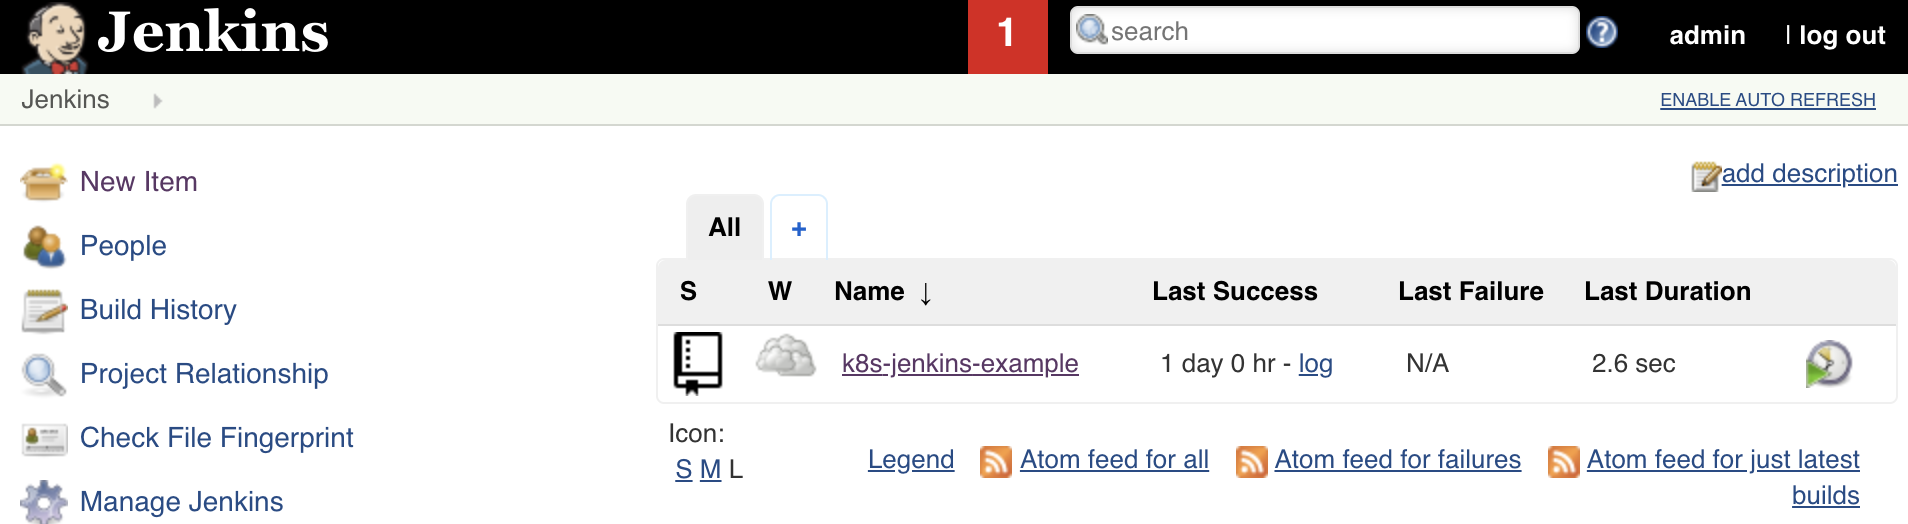
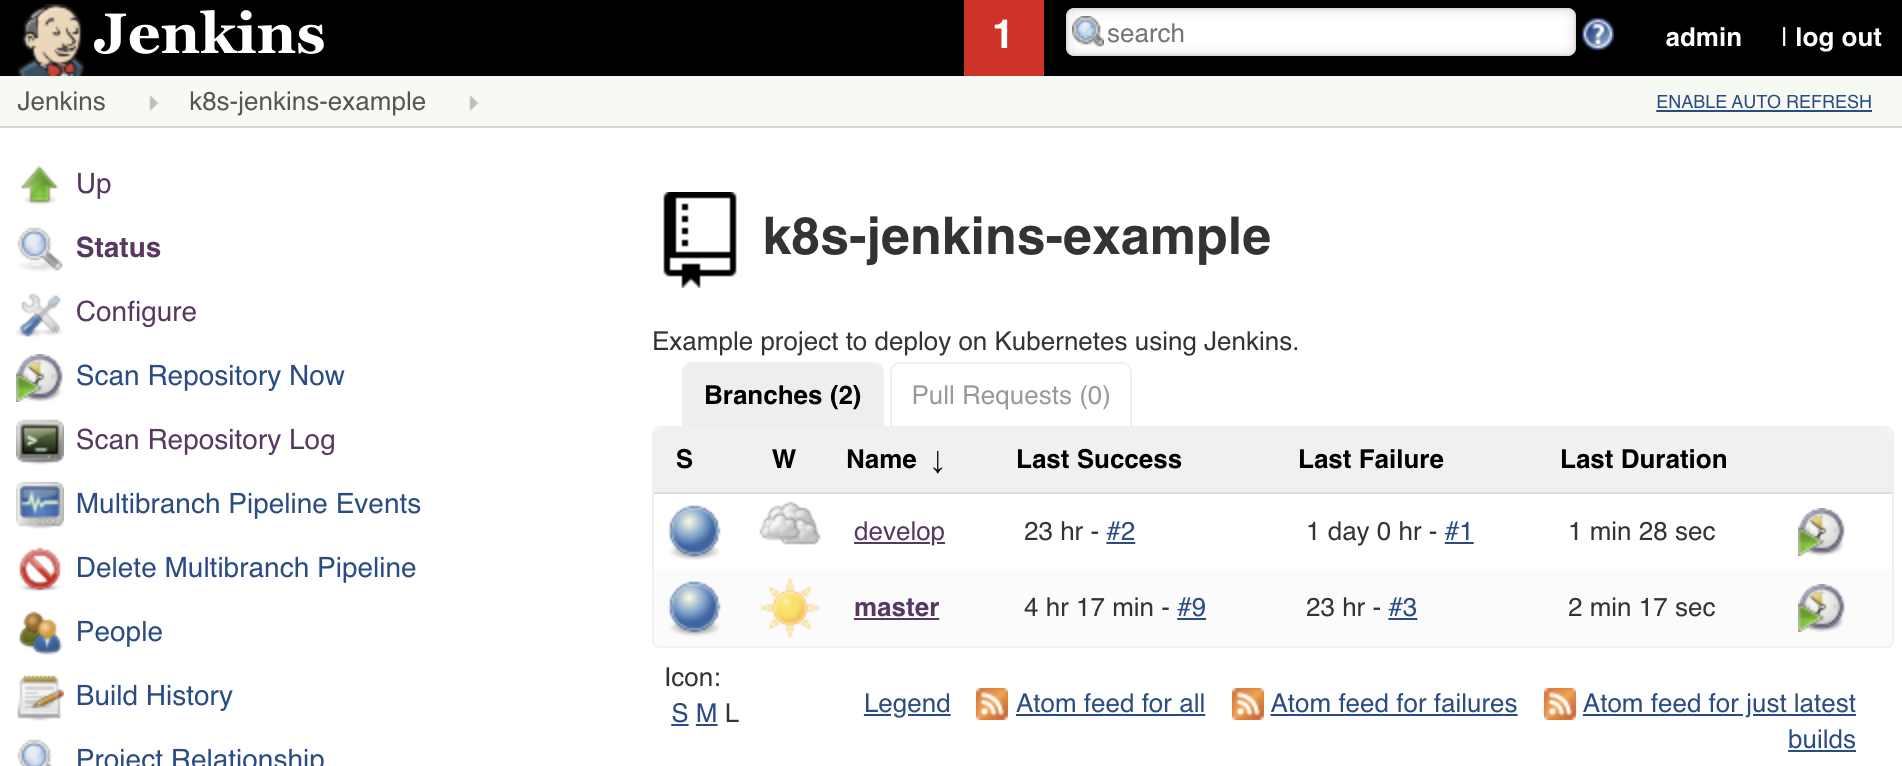
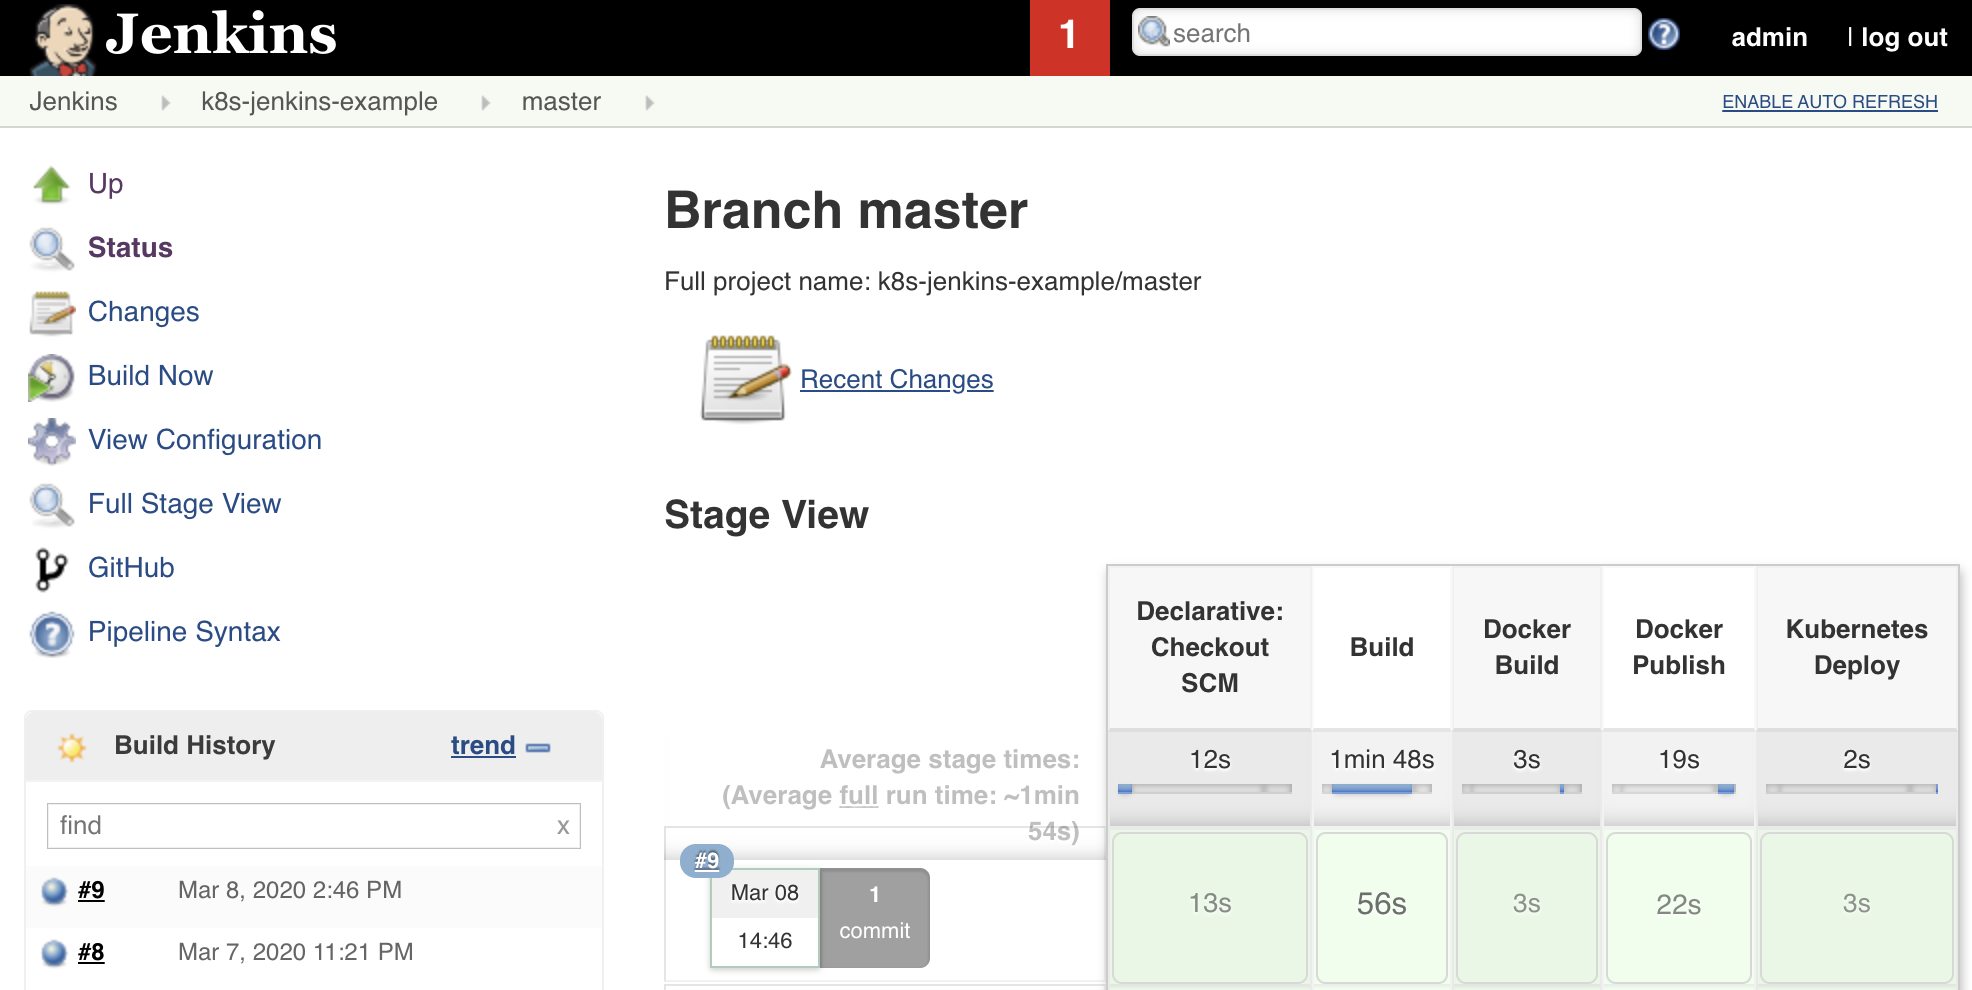 Figure: Jenkins list of jobs, branches and pipeline runs for master branch.
Validate
Now that all pieces are running together and we checked the core functionality, let’s validate if the solution is up for a typical GitFlow development process:
- Build master branch Jenkins job;
- Check that production deploy is running and provides the expected value:
1
2
 ➜  ~ curl -k -w '\n' --request GET 'https://example.localhost/greeting'
{"id":1,"content":"Hello, World","env":"default_value"}
- Create develop branch and build respective Jenkins job;
- Check if staging deployment is running properly:
1
2
 ➜  ~ curl -k -w '\n' --request GET 'https://example-staging.localhost/greeting'
{"id":1,"content":"Hello, World","env":"default_value"}
- Checkout develop branch, and change the default
nameargument value of the greeting method from “World” to “World!”; - Commit and wait for Jenkins job to finish, in order to update the staging deployment;
- Check that default value is changed on staging deployment:
1
2
 ➜  ~ curl -k -w '\n' --request GET 'https://example-staging.localhost/greeting'
{"id":1,"content":"Hello, World!","env":"default_value"}
- Merge develop branch into master branch;
- Wait for master Jenkins job to finish and update production deployment;
- Check if production deployment is properly updated:
1
2
 ➜  ~ curl -k -w '\n' --request GET 'https://example.localhost/greeting'
{"id":1,"content":"Hello, World!","env":"default_value"}
- Yes, everything is working automagically!

Conclusion
The approach presented in this post allows teams to automatically and continuously integrate, deploy, validate and share the performed work, fostering enhanced product quality, developer independency and team collaboration. It is definitely nothing completely new, but the path to achieve it was not so straightforward as initially expected, which required a lot of try and error. Just out of curiosity, check below the Jenkins project status with the required runs until it was executed successfully:
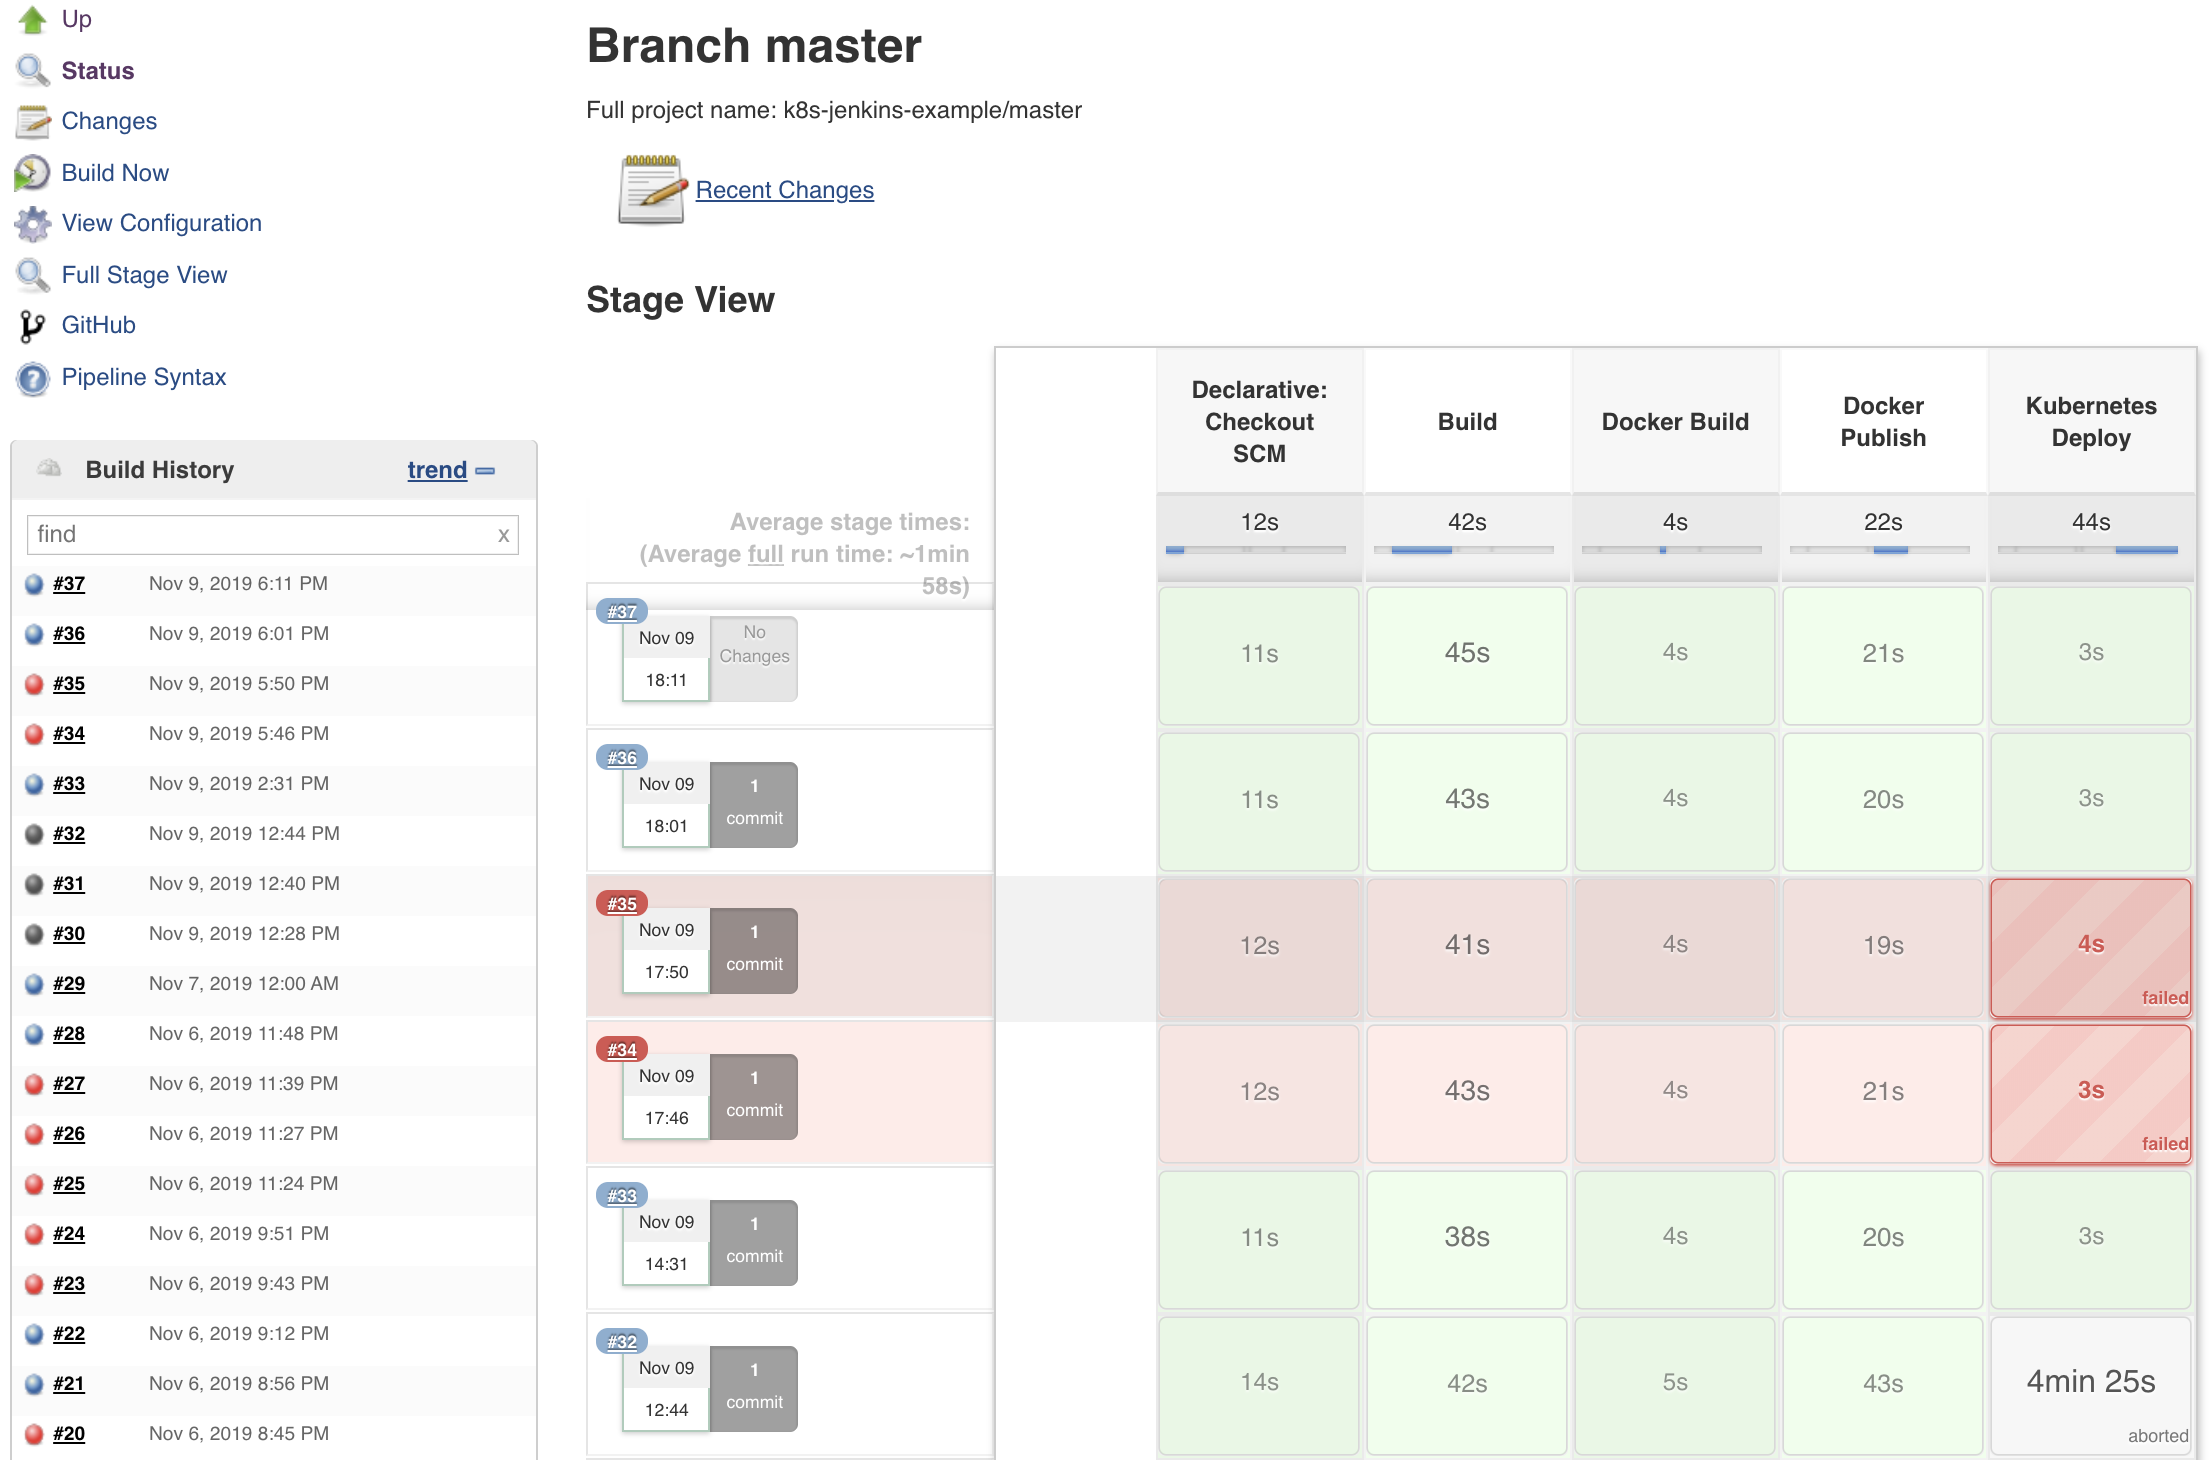 Figure: The path to success.
All in all, I hope this post helps you and your team to easily build your CI/CD pipelines with Jenkins and Kubernetes.
Please remember that your comments, suggestions and contributions are more than welcome.
Let’s automate all the things! ![]()
![]()
Comments